
 ·
2 minute read
·
2 minute read

How can nonprofits and grantmakers work more effectively with one another to create an ecosystem of impact? A must-have component is actionable data. At Catchafire, data is key to understanding the efficacy of our programs; it helps us understand our success and actualize our vision towards equitable support for nonprofits.
In 2020, we began building a stronger data infrastructure with a racial equity lens, with the goal of gathering key insights and trends for our grantmaking and nonprofit partners. This data drives the conversation as we assess the racial makeup of our nonprofit partners and the communities they serve, what gaps exist in who we work with, and how various communities and cause areas use capacity building resources like Catchafire. This allows us to more intentionally work towards racial equity in the social sector and collaborate with funders and nonprofits to strengthen communities.
The first step was gathering the data that highlights how the nonprofits and communities we partner with are being served, with a particular focus on understanding the needs and constraints on Black, Indigenous, and people of color (BIPOC) nonprofits and communities. Our data has demonstrated the correlation between underinvestment in BIPOC communities and a need for equitable access for BIPOC nonprofits. BIPOC-led and BIPOC-serving nonprofits are the organizations making the largest gains on Catchafire when provided with the resources they need to better serve their communities.
When it comes to evaluating Diversity, Equity, and Inclusion (DEI) goals, demographic data for nonprofit leaders and communities served is key to monitoring and evaluating programs. Catchafire’s robust metrics dashboard has been updated with a diversity and equity section in order to address this need, and equip funders with the information they need to more effectively serve their communities.
We began collecting demographic data from our nonprofit partners in December 2020 during their registration process as well as through program surveys. These questions are optional, and the answers can be updated at any time by the nonprofit to reflect current data. The insights from this new data allows us to engage in meaningful conversations with our nonprofit and grantmaking partners around funding, breaking down silos, and how to continue to expand access to capacity building resources for BIPOC nonprofits and communities.
Organizations are asked to provide the:
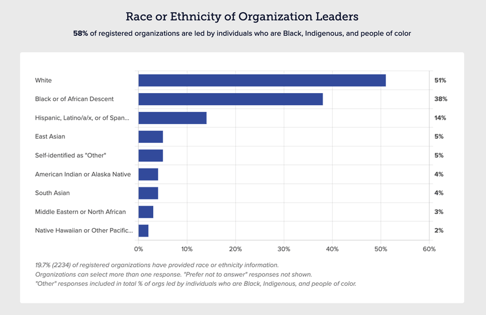
- Racial or ethnic background of the organization’s leader
- Racial or ethnic identities significantly represented in the organization’s target population
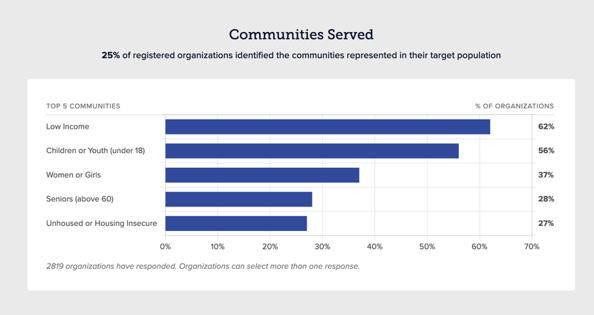
- Communities in the organization’s target population
After beginning to collect this DEI data, Catchafire has seen a high rate of newly registered nonprofits providing DEI demographic data. This data is now available on Catchafire’s public metrics dashboard, and provides funders with a reference point to see the breakdown of who they are serving. Now, Catchafire has a large enough response rate that the DEI insights are statistically representative, providing insights beyond the organizations who have responded. In other words, the results seen here represent the demographic breakdown of the entire Catchafire universe.
Black-led nonprofits on Catchafire realized the most gains last year; 58% of nonprofits on Catchafire have BIPOC leadership and 30% are exclusively Black-led. Twenty four percent of registered organizations identified the communities represented in their target population, which skewed toward low-income populations, youth, women and girls, senior citizens, and community members who were housing insecure. In addition to our public metrics dashboard, our grantmaking partners have private metrics dashboards available for review with specific data on their grantees.
We continue to build upon our data collection process to better understand community demographics, develop insights, and provide our findings to our foundation partners. With this data, foundations can evaluate their funding approach, their goals and DEI benchmarks, and how to expand their impact in their communities. This dashboard is one step of many, and an ongoing conversation for our community.